
Show Statistics (continued)
If you click the Graph Fuel button, this graph will be displayed:
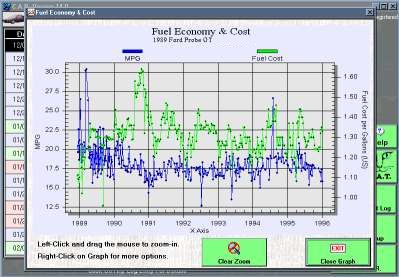
The graph shows the fuel economy and the
per-unit cost from all the Fuel Entries. Note the "Desert Storm"
peak in the fuel cost in late 1990.
You can use your mouse to zoom in for a closer look:
![]()
![]()